
Flowing Through Trouble: India’s Most Polluted River Stretches and the Road to Revival
India’s rivers face severe pollution from sewage, industry, and waste; CPCB data shows slight improvement but many stretches remain unsafe, demanding urgent upgrades in treatment, regulation, and community-led river restoration.
CASE STUDYEDUCATIONAL
Rimashree
2/11/20264 min read
Rivers are more than water flowing in a channel — they’re life arteries for ecosystems, cultures, economies, and communities. But in India, many of these arteries are clogged with pollution — untreated sewage, industrial effluent, and waste that turns flowing water into stagnant soup. The Central Pollution Control Board (CPCB), India’s official watchdog for water quality, regularly maps and categorizes river health. Their latest assessment (based on 2022–23 data) paints a mixed picture — some hope but a whole lot of pain.
What CPCB Actually Found: The State of Our Rivers
The CPCB identifies a “polluted river stretch” when two or more consecutive monitoring sites on a river exceed safe limits of Biochemical Oxygen Demand (BOD) — a key metric of organic pollution. A BOD above 3 mg/L means the water isn’t safe for bathing, and anything above 30 mg/L drops the river into the most polluted bracket (Priority I).
By the Numbers (2023 Report)
296 polluted river stretches identified across 271 rivers in India — a slight decline from 311 stretches in the previous survey.
807 river locations were found unfit for bathing due to high pollution — a minor drop from 815 a year earlier.
37 stretches still fall into the worst-ranked Priority I, meaning dangerously high organic pollution that threatens life in and around the water.
So yes, there’s marginal improvement, but the picture remains ugly in spots and stagnant in others.
Where the Pain Is Most Acute
Pollution isn’t evenly spread. Some states bear the brunt:
Maharashtra: The Hotspot
Maharashtra has the highest number of polluted stretches — 54 — more than any other state.
Urban waterways like Mithi, Dahisar, Poisar, Oshiwara, and Ulhas near Mumbai still carry heavy loads of untreated sewage, industrial discharge, and household waste, with BOD levels often soaring well above safe limits.
These are rivers that have become more like open drains in places — and that’s not just poetic flair, that’s what the data suggests.
Northern Parade of Pain
The Yamuna stretch from Palla to Asgarpur in Delhi continues to be one of the most polluted in the country — with BOD levels teetering around values far above safe criteria.
States Struggling with Priority I Stretches
Tamil Nadu, Uttar Pradesh, and Uttarakhand each have five Priority I stretches, meaning urgent attention is needed.
Other states like Kerala (31 polluted stretches), Madhya Pradesh (18), Manipur (18), and Karnataka (14) also show up prominently on the CPCB list.
Why This Pollution Happens (the Real Meat)
So what’s turning beautiful rivers into chemical rivers? It’s not just one villain — it’s a whole dysfunctional squad:
Untreated Sewage
Cities and towns collectively generate tens of thousands of million liters of sewage daily. Shockingly, only a small fraction gets treated before being dumped into rivers. Even when sewage treatment plants (STPs) exist, many are non-functional or over-capacity. This consistently pushes BOD levels above safe limits.Industrial Effluents
Factories — leather, textiles, chemicals, pharmaceuticals — often discharge wastewater loaded with organic and inorganic pollutants. When industries don’t follow treatment norms, rivers become the catch-all.Solid Waste & Encroachments
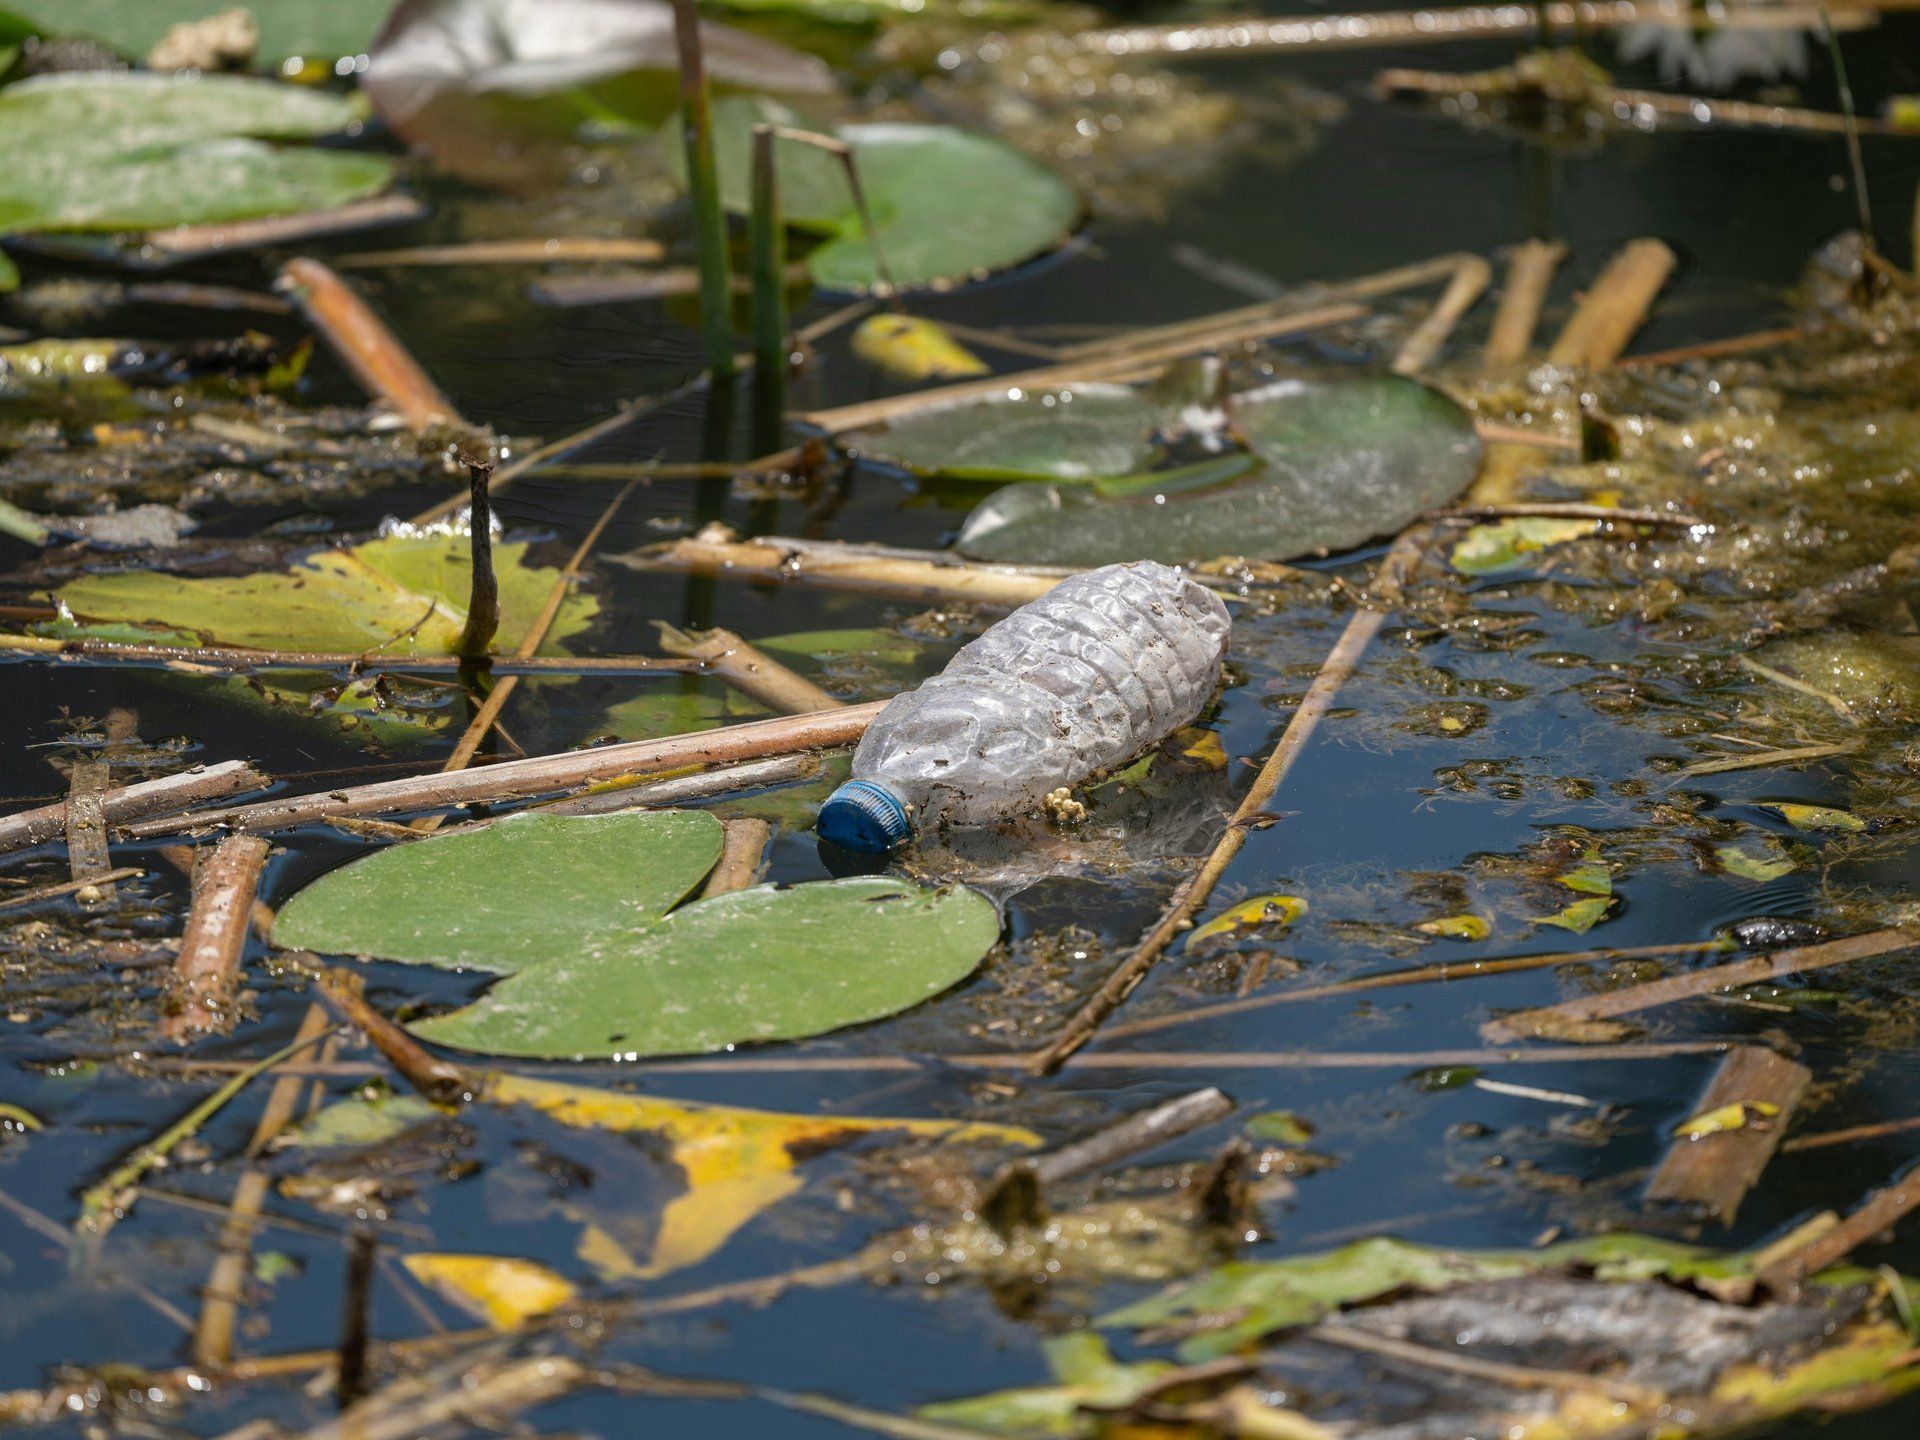
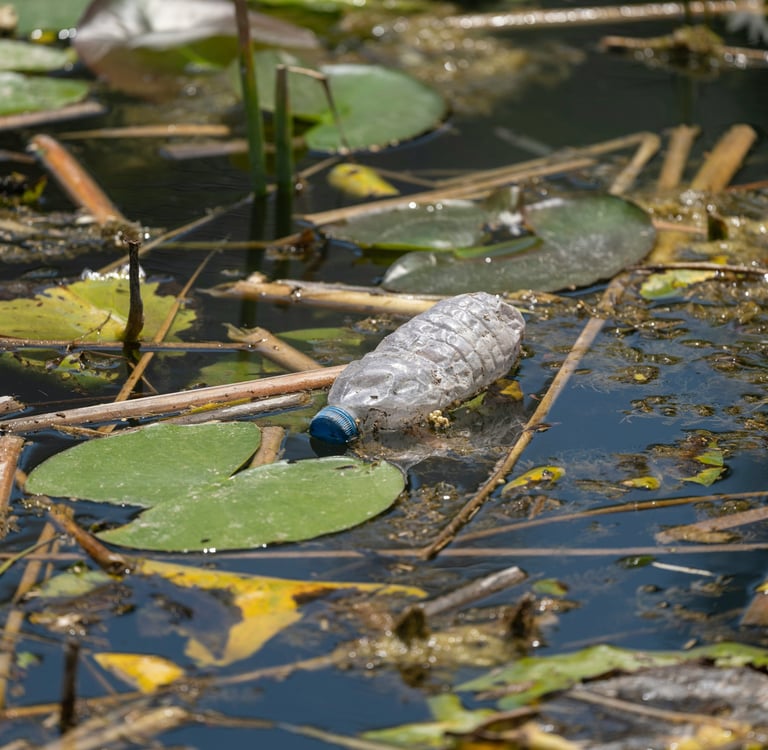
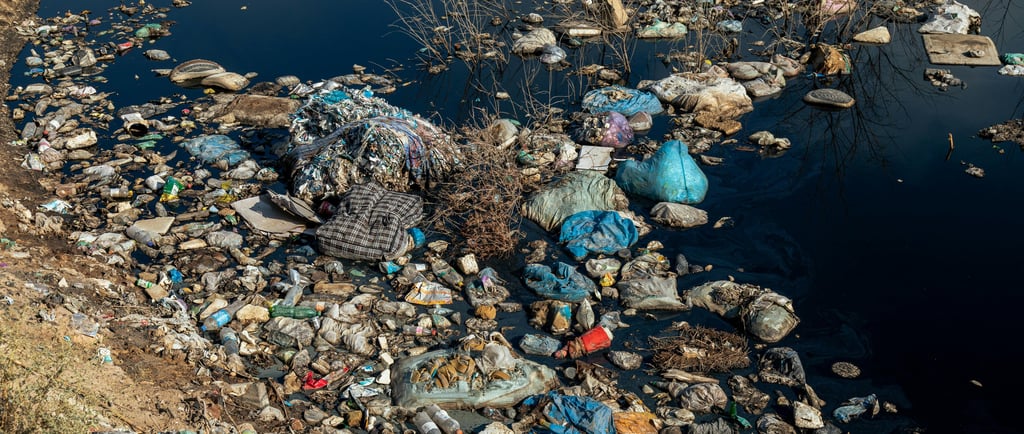
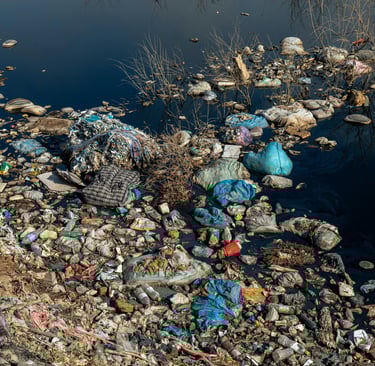
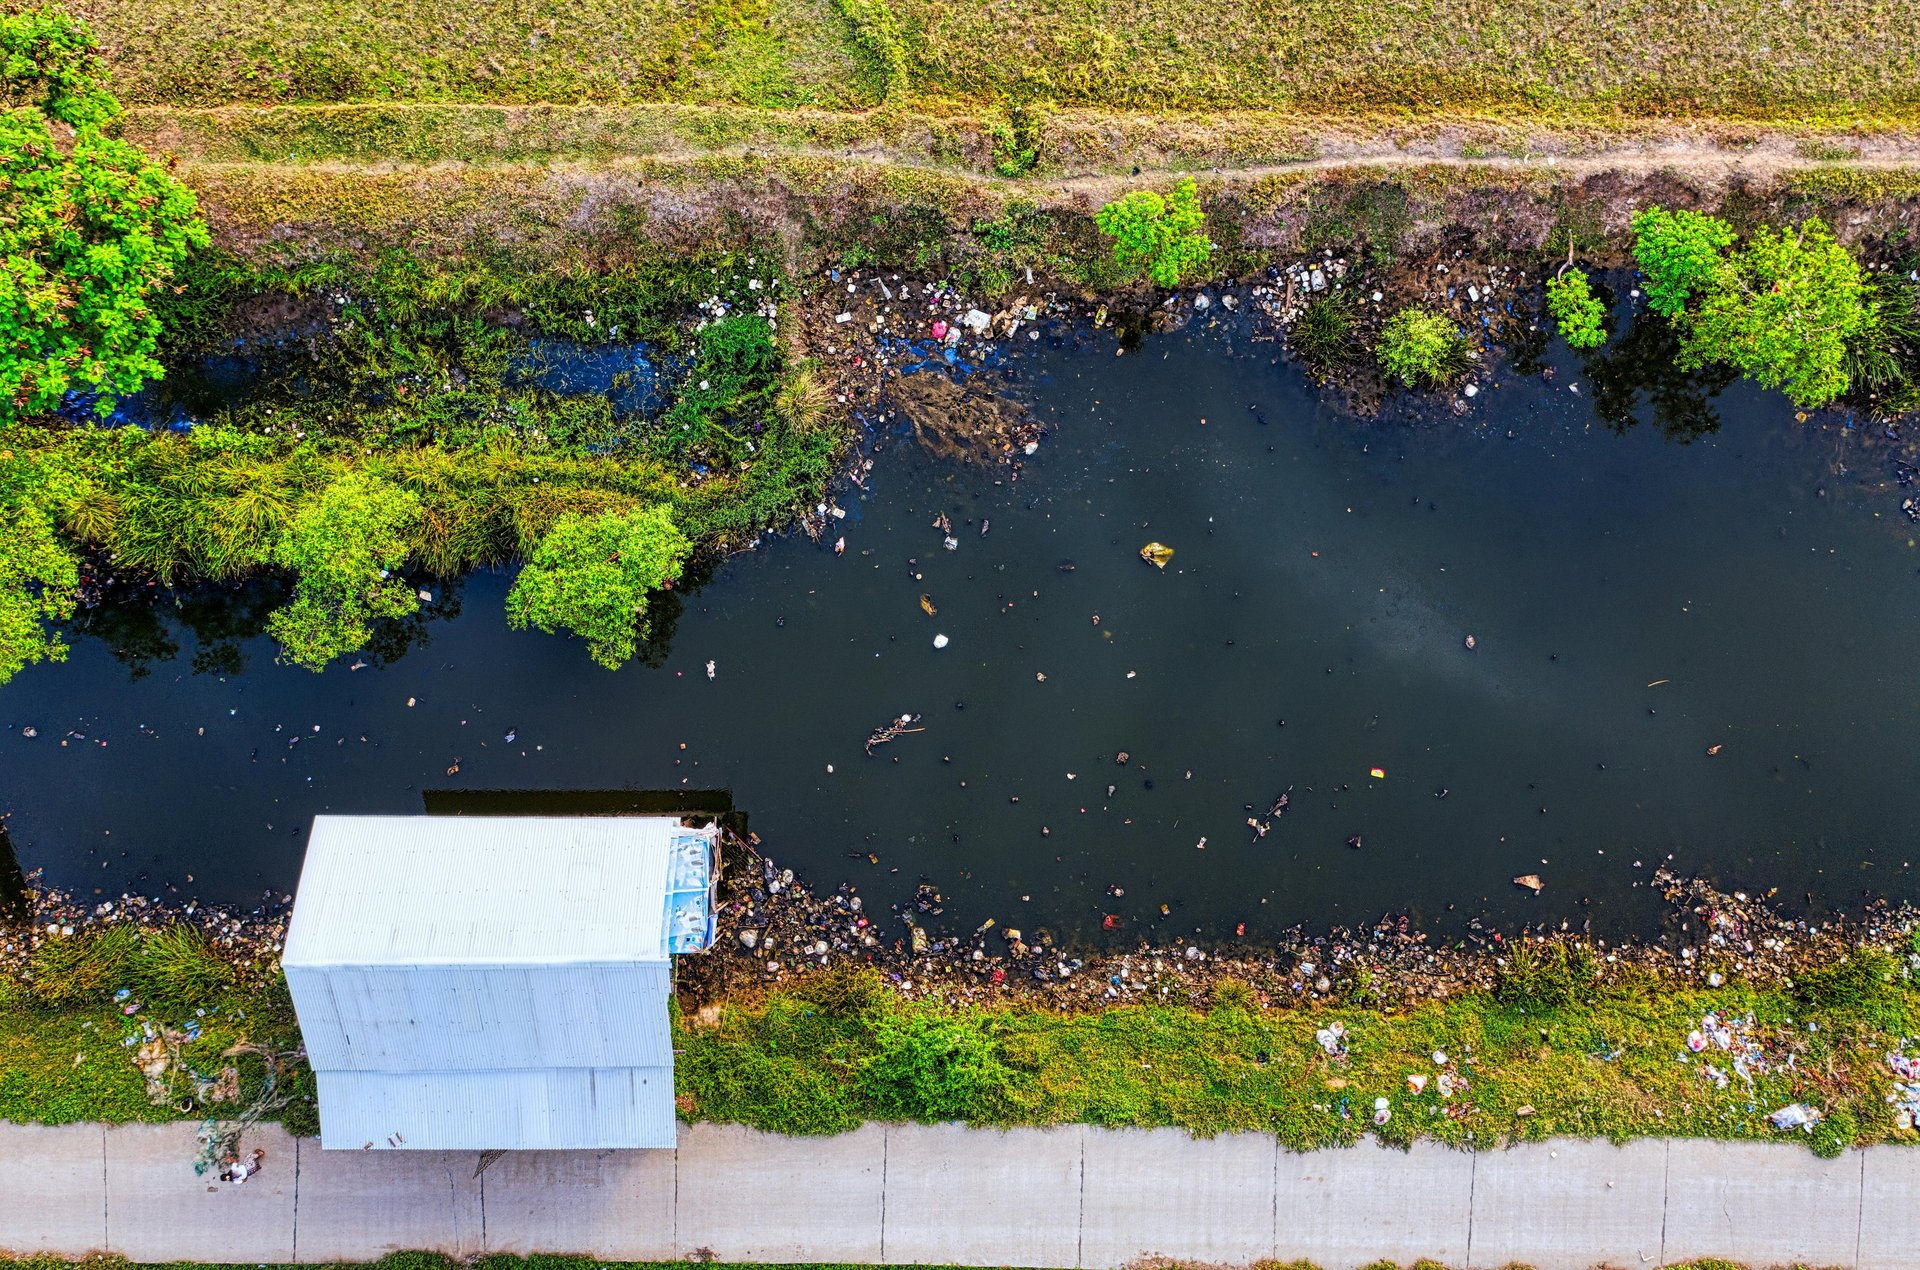
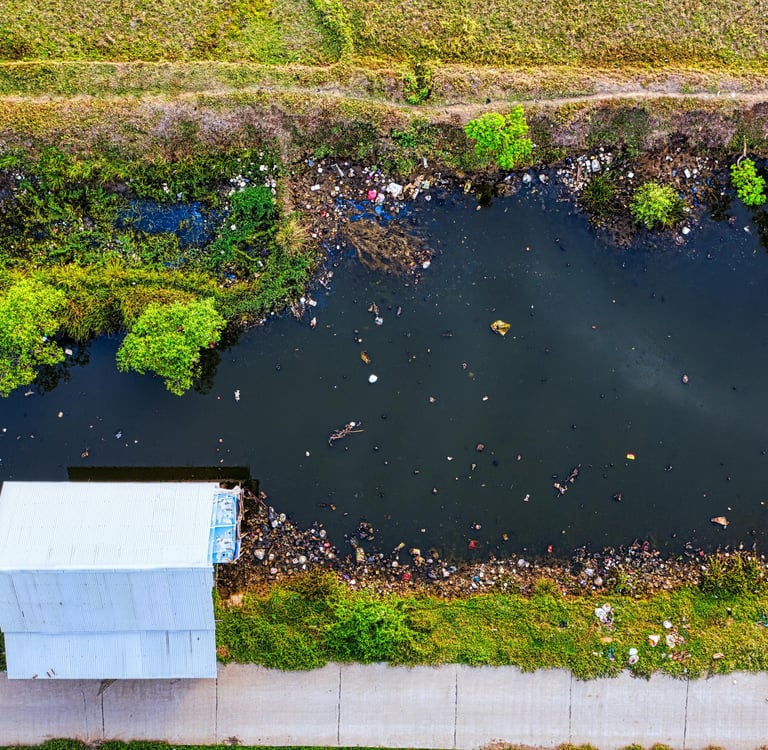
Plastic, garbage, construction debris — everything finds its way to river banks, choking flow and increasing pollution loads. Urban rivers are especially vulnerable.Agricultural Runoff
Fertilizers and pesticides wash from fields into rivers, increasing nitrate and phosphate loads and reducing water quality across entire basins.
How We Can Truly Improve Our Rivers (No Fairy Dust, Real Ideas)
Real Ideas)It’s cool to talk about problems — but you’re reading a blog that wants solutions. So let’s get into practical, actionable steps:
Scale Up Sewage Treatment (Seriously)
Build functional STPs with capacity matched to urban growth. Ensure existing plants aren’t just monuments but actually treat water to standards before release. Sewage is the leading cause of high BOD — fixing it moves the needle fast.Zero Discharge Rules for Industries
Make Zero Liquid Discharge (ZLD) non-negotiable for industries near rivers. If factories can’t treat and reuse wastewater, they shouldn’t discharge — full stop.Green Buffer Zones & Natural Filters
Plant riparian buffers — trees, grasses, wetlands — alongside rivers. These act like natural sponges and filters, removing nutrients and slowing runoff before it hits the water.Solid Waste Management, Not Band-Aid Solutions
Proper waste segregation, recycling, and decentralized composting keeps trash off riverbanks. Better waste management reduces plastics and household waste ending up in water bodies.Community Monitoring & Accountability
Let local communities participate in water quality monitoring. Citizen science platforms can tip off authorities faster than red tape. When locals care, enforcement becomes easier.Data-Driven Policy + Public Transparency
Use CPCB data to enforce penalties and prioritize clean-up operations. Public dashboards and real-time pollution alerts help everyone stay informed and accountable.
Final Flow: From Facts to Future
Here’s the cold, honest truth: India’s rivers aren’t dying, but they’re hurting — and the data clearly shows that targeted action does lead to improvements. We’re seeing fewer polluted stretches and lower severity in some cases, but the worst bits still need urgent, systemic fixes.
This isn’t just an environmental issue — it’s a public health, economic, and cultural crisis. Rivers carry our livelihoods, our histories, and our spiritual identities. They deserve better than being used as dumping grounds.
The CPCB’s numbers are not just statistics — they’re a call to action. If policymakers, industries, communities, and citizens collaborate — especially on sewage treatment, industrial regulation, and waste management — we can flip the script and see rivers that are reviving instead of declining. Pollution isn’t an eternal sentence — it’s a problem with known causes and proven solutions.
So let’s not just read the data. Let’s use it.
Know more at:
https://cpcb.nic.in/openpdffile.php?id=UmVwb3J0RmlsZXMvMTQ5NF8xNjcxNzc3ODg2
X21lZGlhcGhvdG8xODc0Ni5wZGY=
https://cpcb.nic.in/wqm/RS-criteria-status.pdf
Photo by Collab Media: https://www.pexels.com/photo/plastic-waste-on-a-riverbank-15060365/
Photo by engin akyurt on Unsplash
Photo by Tom Fisk: https://www.pexels.com/photo/drone-photography-of-a-river-7350891/